Earlier this week I was on YouTube and saw a video from a real estate agent talking about “the upcoming real estate market crash.” I have to admit, the agent made some good points but I kept finding myself saying things like “that’s only half the story”, “what about the homes that have come out of forbearance”, and “no, that’s not what happened in 2008.” A couple of days later, back on YouTube (doing research I promise!) I came across another video, from a different agent, talking about why the real estate market wasn’t heading for a crash.
I have to admit, I didn’t know what to believe after watching both of those videos, and this is what I do every day! I can only imagine how confusing it must be for anyone currently considering buying or selling a home.
I have always believed that my role as a real estate professional isn’t to try and convince anyone of anything but to present the information, and help people interpret that information, so they can make the best decision for their own situation. It should never be about the buying or selling, but about helping people be informed enough to reach their own conclusion on what’s best for them.
All that being said, is the real estate market heading for a crash?
Truth is, I can’t answer that question, and neither can anyone else, with certainty. What I can tell you is that there will be a “correction” at some point in the real estate market. It runs in cycles, but a correction is not the same thing as a crash.
Do I think this correction will happen in the next year or two? No.
Why do I think we are more likely to see a correction than a crash like we saw in 2008?
There are 6 reasons why the current real estate market is nothing like it was in 2008. Want to know what they are? Watch the following video or continue reading below:
At the beginning of the pandemic last year, there were many in the housing industry that feared the real estate market would experience a significant decline. Instead, real estate had one of its strongest years ever. Demand for housing soared as mortgage rates dropped causing both sales and prices to increase substantially over the year before. The real estate market’s enthusiasm caused some to believe that we were starting to mirror the market of the mid-2000s and, as a result, are now heading toward another crash.
As mentioned above, this real estate market is nothing like 2008. Here are 6 key differences;
1) Mortgage Standards are Very Different Now
Getting a mortgage in the early 2000s was not difficult. Fog a mirror, sign your name, get a loan. Why bother checking to see if the applicant could actually afford to make the payments, or even have a job for that matter! Today, it is much harder to qualify. The Urban Institute recently released their latest Housing Credit Availability Index (HCAI) which “measures the percentage of owner-occupied home purchase loans that are likely to default - that is, go unpaid for more than 90 days past their due date. A lower HCAI indicates that lenders are unwilling to tolerate defaults and are imposing tighter lending standards, making it harder to get a loan. A higher HCAI indicates that lenders are willing to tolerate defaults and are taking more risks, making it easier to get a loan.”
The index shows that lenders were comfortable taking on high levels of risk during the housing boom years of 2004 - 2006. It also shows that today, the HCAI is under 5%, which is the lowest it has been since the index was introduced. The report explains:
“Significant space remains to safely expand the credit box. If the current default risk was doubled across all channels, risk would still be well within the pre-crisis standard of 12.5% from 2001 to 2003 for the whole mortgage market.”
As you can see, the current default risk is nothing like it was last time.
2) Home Prices are Up, but not Soaring Out of Control
I know this may come as a surprise to anyone that has been actively looking for a home the past few months, but what we experienced in the second half of 2020 is not indicative of a trend and the pace of home price appreciation is expected to slow this year. The graph below shows the average annual home price appreciation (nationally) over the past four years compared to the four years immediately preceding the height of the housing bubble.
While each market is different in terms of actual percentages (we saw 15% year over year in Frisco and Prosper, and 19% in Temecula, CA) the overall pace of appreciation the past four years is lower than what was experienced prior to the crash in 2008. Historically, the average annual price appreciation nationally, going back to the end of WWII is 3.8%. When you plot that annual pace of appreciation against the national median home price we are only now getting back to the level of where prices should be historically. In 2008, we had been running above that trend line for several years.
3) There is a Shortage of Homes For Sale
A real estate market is considered balanced, not favoring sellers or buyers, when there is approximately six months worth of inventory. Months of inventory, in real estate, refers to the length of time it would take to sell all the homes currently on the market at the current pace of sales. Anything higher than a six-month supply generally causes home prices to decline, and anything less than a six-month supply causes prices to increase. The following graph shows national housing inventory in the four years prior to 2008 compared with national housing inventory the past four years.
In the real estate markets my team operates in, inventory is even lower than the national average. In both Frisco, TX and Prosper, TX there is currently a 2 week supply, and in Temecula, CA there is 0.9 months supply. The severe undersupply of homes for sale in these markets is what is causing the home price appreciation we are seeing.
4) New Construction isn’t Filling the Void
It would be easy to assume that new construction homes must be filling the supply void, but that isn’t the case. Believe it or not, new construction still hasn’t returned to the construction levels experienced prior to the crash in 2008. When you consider the number of new households being created, population increases, and the fact that Millennials are reaching prime home-buying age, there is simply not enough supply to satisfy current demand.
5) Homes are not too Expensive to Buy
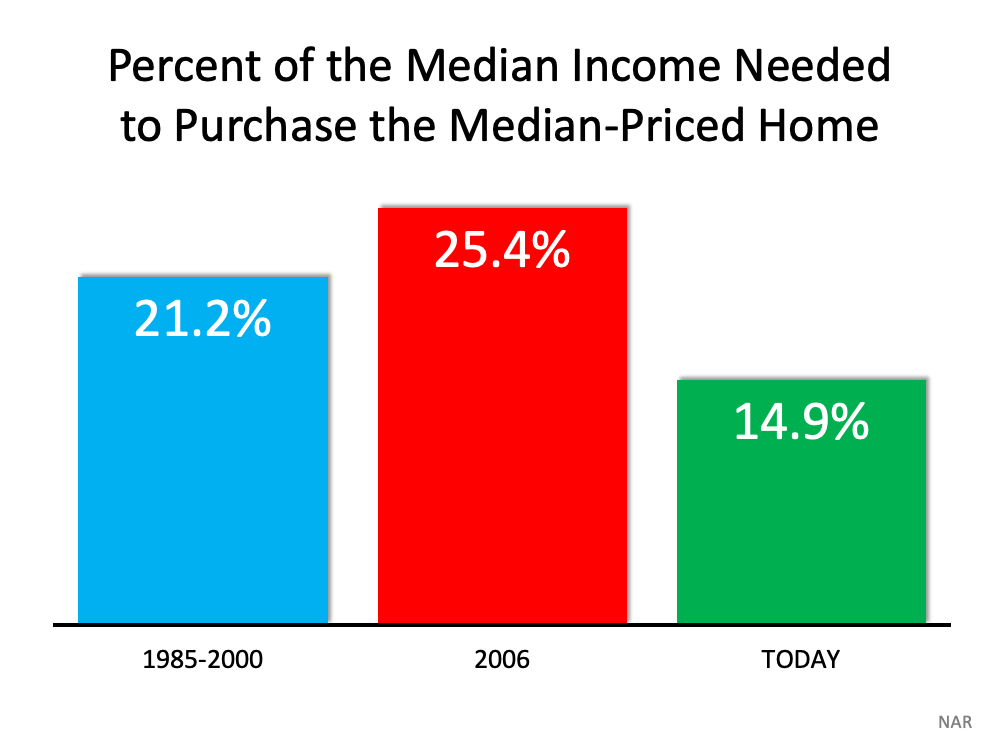
Considering how much homes have gone up in value the past year it would be easy to assume that homes are becoming unaffordable, but the affordability formula has three components: the price of the home, the wages earned by the purchaser, and the mortgage rate available at the time of purchase. Fifteen years ago, prices were high, wages were low, and mortgage rates were over 6%. Today, prices are still high, but wages have increased, and mortgage rates are around 3%. That means the average homeowner actually pays less of their monthly income toward their mortgage payment now than they did back then. This chart shows the difference:
This will obviously vary from area to area, but as Mark Fleming, Chief Economist for First American, explains:
“Lower mortgage interest rates and rising incomes correspond with higher house prices as buyers can afford to borrow and buy more. If housing is appropriately values, house-buying power should equal or outpace the median sale price of a home. Looking back at the bubble years, house prices exceeded house-buying power in 2006, but today house-buying power is nearly twice as high as the median sale price nationally.”
6) Homeowners are Equity Rich
In addition to the mortgage loans that allowed homebuyers to buy a home without having to actually qualify or put money down, and ultra-low teaser rates to keep the payments low for the first couple of years, homeowners were using their homes as personal ATM machines. Cash-out refinances exploded as people funded everything from vacations, to cars, to clothes. Over the last decade, home prices have risen nicely leading to over 50% of all homes in the country having greater than 50% equity. In addition, homeowners have not been tapping into that equity like before. The table below shows the difference in equity withdrawal over the last three years compared to 2005, 2006, and 2007. Homeowners have cashed out almost $500 billion less than before:
During the crash, when home values started to fall, homeowners quickly found themselves in a negative equity situation (where the amount of the mortgage owed exceeds the market value of the home). Some homeowners decided to walk away from their homes, which led to a wave of distressed property listings (foreclosures and short sales), which sold at discounts leading to a further decline in the value of other homes in the area. Today, the average amount of equity a homeowner is sitting on is over $190,000, meaning even if home prices flatten and/or declined slightly, we won’t see a repeat of what happened in 2008.
Bottom Line
The real estate market today is very different than what we experienced in 2008. Will home prices continue to appreciate as they have for the last decade? No. The real estate market always runs in cycles and this cycle won’t last forever. Inventory will go up, home prices will eventually flatten, and probably go down slightly, but currently, there isn’t any indication that another “crash” is on the horizon.
If you have additional questions about the real estate market or have a particular situation you would like to discuss in more detail, please Schedule a Call. There is never a cost or obligation.


